What Is Interval Meter Data? How Utilities Measure Electricity Demand
What Interval Meter Data Is
Interval meter data is a detailed record of electricity demand measured at fixed time intervals rather than summarized monthly. Utilities record the average power demand during each interval, typically every 15 or 30 minutes, and store those readings as part of the meter’s historical usage data.
Instead of a single monthly total, interval data contains many measurements across the billing period. Each measurement represents the building’s demand during one interval. The highest interval demand recorded during the billing cycle becomes the peak demand used to calculate demand charges on the electricity bill.
Utilities such as ComEd provide up to 24 months of this interval demand data for accounts with recording-type meters. When the data is analyzed or graphed, it reveals how a facility’s electricity demand rises and falls throughout the day, allowing analysts to identify the specific events that create peak demand charges.
How Electric Interval Meters Record Electricity Usage
Electric interval meters continuously measure the flow of electricity through a service connection. Instead of displaying only a cumulative total like older analog meters, interval meters record electricity usage over fixed measurement windows, typically 15 or 30 minutes.
During each interval the meter calculates the average power demand for that period and stores the value in its internal memory. Over the course of a billing cycle this creates a sequence of demand readings representing the building’s electrical load throughout the day.
Utilities later retrieve these readings and use them to determine the highest demand recorded during the billing period. That value becomes the building’s billing demand and is used to calculate demand charges on the electricity bill.
15 Minute vs 30 Minute Demand Intervals
Utilities record electricity demand in fixed measurement intervals, most commonly 15 or 30 minutes. Each interval represents the building’s average demand during that window. Some utilities use 15-minute intervals, while others, including ComEd in the dataset shown here, record demand in 30-minute intervals. Regardless of the interval length, the highest recorded interval during the billing period becomes the building’s peak demand used to calculate demand charges.
“The most expensive electricity you use may last only thirty minutes.”
What an Electric Load Profile Shows
An electric load profile is a visual representation of interval demand data. Instead of showing a single monthly total, the load profile reveals how a building’s electricity demand rises and falls throughout the day.
Example Load Profile From Interval Meter Data
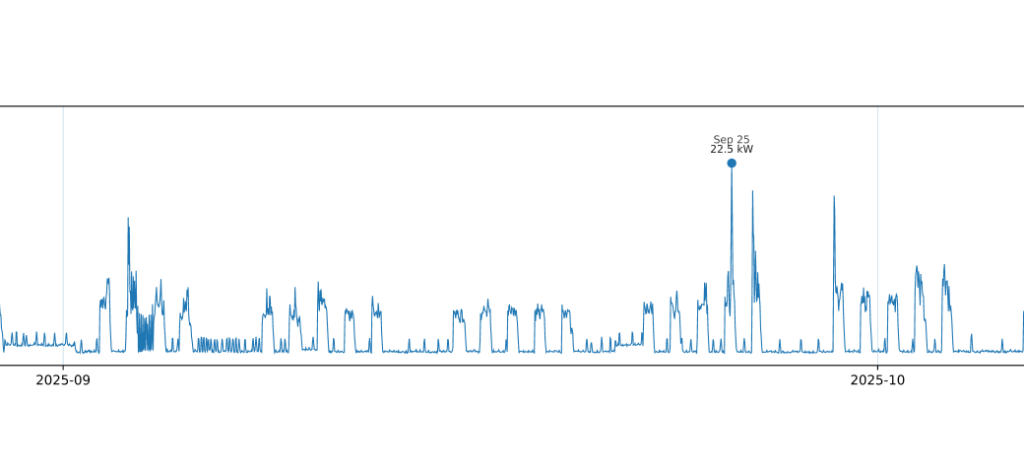
In the graph above, each point represents the building’s average demand during a measurement interval. Most of the facility operates at a relatively low baseline demand, but on September 25 the demand spikes sharply. That spike reaches 22.5 kW, which becomes the highest demand recorded during the billing period.
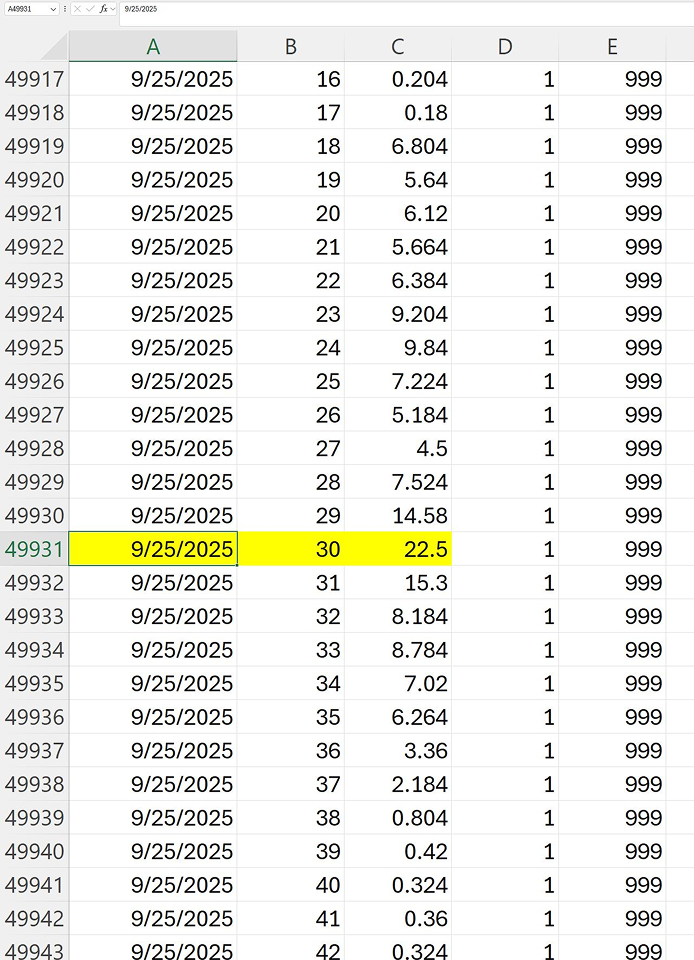
The interval dataset below shows the exact measurement that produced that spike. Each row represents a demand reading recorded by the electric meter. The highlighted row corresponds to interval 30 on September 25, where the meter recorded a demand of 22.5 kW.
Example Interval Meter Data From an Electric Meter
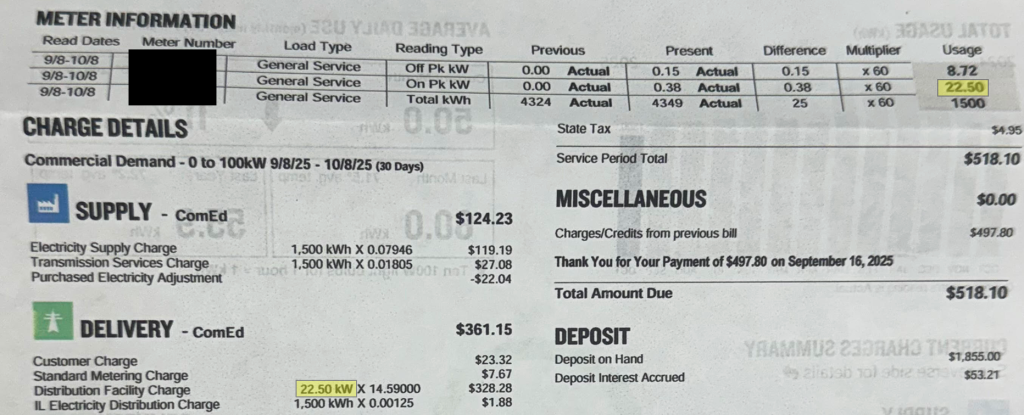
Utilities calculate demand charges using the single highest interval demand recorded during the billing cycle. When the bill is generated, that value appears as the building’s billing demand. In the bill shown below, the same 22.5 kW measurement is used to calculate the distribution demand charge.
Electricity Bill Showing the Billing Demand
Together these three views show how demand charges are created:
• the electric meter records demand during each measurement interval
• the load profile visualizes those measurements over time
• the highest interval becomes the billing demand on the electricity bill
In this example, a single 30 minute demand event determines the demand charge applied to the entire month.
How Interval Data Reveals Peak Demand Events
Peak demand events become visible only when electricity usage is measured at short time intervals. Monthly electricity bills report the highest demand recorded during the billing period, but they do not reveal when that peak occurred or what operational activity caused it.
Interval data exposes those events by showing how demand changes throughout the day. When the data is graphed as a load profile, short periods of unusually high demand appear as sharp spikes above the building’s normal operating level.
These spikes often correspond to specific operational events inside the facility. Large motors starting, HVAC systems beginning their daily cycle, or multiple pieces of equipment starting simultaneously can briefly push demand far above the building’s normal load. Because utilities determine billing demand using the highest recorded interval, even a short spike can determine the demand charge for the entire month.
By examining interval data, analysts can identify the timing and magnitude of these events. Once the cause is understood, facilities can often reduce demand charges by adjusting equipment schedules, staggering equipment startup, or controlling large loads during critical intervals.
Why Monthly Electricity Bills Hide These Patterns
A monthly electricity bill summarizes the outcome of the billing period, not the operational events that produced it. The bill typically reports two key numbers: the total energy consumed during the month and the single highest demand recorded during the billing cycle.
What the bill does not show is when that peak demand occurred or what activity inside the building caused it. A demand charge might be created by a single short event, such as equipment starting at the same time, but the bill only displays the final peak demand value used for billing.
Because the bill aggregates the entire month into a few summary numbers, the operational patterns that produced those charges are not visible. Two facilities could show the same peak demand on their bills while having completely different load behavior throughout the month.
Interval meter data preserves that missing context. By recording demand throughout the day, it reveals the timing and shape of demand events that determine the billing demand.
Frequently Asked Questions
When would you use interval data?
Interval data is used when analyzing how electricity demand changes throughout the day. It allows facility managers, analysts, and engineers to identify peak demand events, understand load patterns, and determine which operational activities are driving electricity costs.
What are the advantages of interval data?
Interval data reveals the timing and magnitude of electricity demand throughout the day rather than only providing monthly totals. This makes it possible to identify peak demand events, detect unusual load behavior, evaluate operational schedules, and analyze how electricity demand contributes to demand charges.
How do utilities use interval data to calculate demand charges?
Utilities measure electricity demand during fixed intervals, typically every 15 or 30 minutes. The meter records the average demand during each interval throughout the billing cycle. The highest recorded interval demand becomes the building’s billing demand, which is multiplied by the demand rate in the tariff to calculate the demand charge.
How do I request my interval meter data from the utility?
Most utilities provide historical interval data for accounts with recording meters. Customers can request this data through the utility’s online data access portal or by submitting a usage data request. The utility typically provides the data as a spreadsheet or data file containing the demand recorded during each measurement interval.