How Businesses Reduce Demand Charges on Electricity Bills
How Demand Charges Are Created
Reduce demand charges by understanding how utilities measure peak electricity demand during the billing period. Commercial electric meters record power usage in regular intervals, typically every 15 or 30 minutes, calculating the average power draw in kilowatts (kW) for each interval. The highest interval average recorded during the month becomes the building’s peak demand. The utility then applies the demand charge rate to that value using a simple formula: peak demand in kW multiplied by the demand rate in dollars per kW. Because only the single highest interval is used, a brief period of elevated power use can determine the demand charge for the entire month.
What Causes Peak Demand Events in Buildings
Peak demand events occur when electrical loads reach unusually high levels during the utility’s demand measurement interval, typically 15 or 30 minutes. Because the highest interval average becomes the building’s billing demand, a short burst of elevated power use can determine the demand charge for the entire month. The interval traces below illustrate how these peaks can arise in different types of facilities.
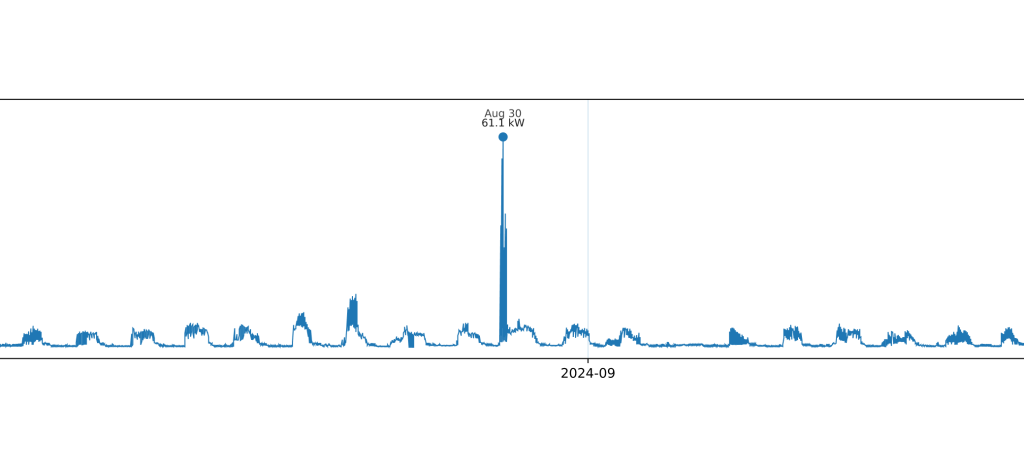
The first example shows a distillery. For most of the day the facility operates at a relatively low base load, but when the still is started the demand jumps sharply to more than 60 kW. Although the spike lasts only briefly, that single interval becomes the highest demand recorded during the billing period. In this case, the demand charge is determined by a single operational event that occurs infrequently but requires a large amount of power when it does occur.
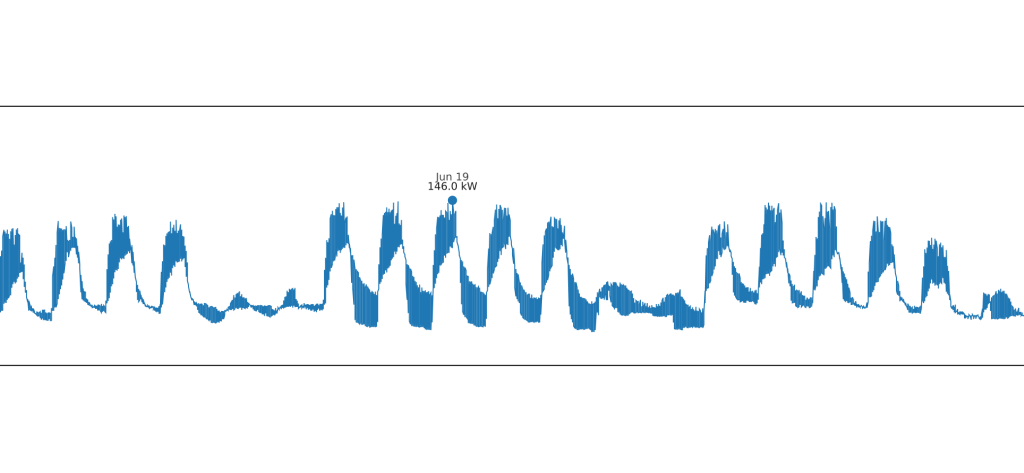
The second example shows a manufacturing facility. Instead of a single extreme spike, the load profile follows a regular daily pattern where production equipment and HVAC systems operate according to a schedule. Demand increases as operations begin and gradually declines when activity slows or stops, but the peak remains close to the facility’s normal operating level. Because electricity use is distributed more consistently throughout the day, this type of profile typically results in a much higher load factor.
These examples show that peak demand is not determined solely by the total amount of electricity a building uses, but by how its electrical loads align within short measurement intervals. Facilities with brief, infrequent spikes often experience disproportionately high demand charges, while facilities with steady operational loads tend to produce more stable and predictable demand profiles.
Why Short Demand Spikes Drive Electricity Costs
Short demand spikes can dominate electricity costs because utilities must maintain enough generation and grid capacity to meet demand whenever it occurs. Even if a facility draws a high level of power for only a brief interval, the electrical system must still be capable of delivering that power instantly. To ensure this, utilities build and maintain power plants, transmission lines, and substations sized to handle peak demand across the grid. Because these infrastructure costs exist regardless of how often the peak occurs, utilities recover part of that cost through demand charges. A facility that occasionally jumps from a low base load to a very high demand level effectively requires the grid to maintain capacity for that momentary spike.
“Demand charges are the cost of being ready for your building’s highest moment of electricity use.”
Operational Strategies That Reduce Peak Demand
Many demand spikes are caused by operational timing rather than total energy use. As a result, some of the most effective demand reduction strategies involve changing how equipment is scheduled. Facilities can stagger equipment startup so that large loads do not turn on at the same moment. Building automation systems can sequence HVAC systems, pumps, and compressors so that they start gradually instead of simultaneously during morning startup. Industrial operations can also schedule high-load processes at different times of day to avoid overlapping demand intervals. By spreading large loads across multiple intervals, these operational adjustments reduce the highest recorded demand without necessarily reducing the total energy consumed.
Technical Systems Used to Control Demand
In addition to operational changes, many facilities use technical systems designed specifically to manage peak demand. Variable frequency drives and soft starters can reduce the electrical surge that occurs when large motors start. Building management systems can monitor real-time demand and temporarily shed noncritical loads if demand approaches a predefined threshold. Some facilities also use battery energy storage or thermal storage systems to perform peak shaving, supplying a portion of the building’s power during short demand spikes. These technologies help smooth the building’s load profile so that short-duration spikes do not set the monthly peak demand.
Why Electricity Bills Cannot Reveal the Cause of Demand Spikes
Monthly electricity bills are designed for billing purposes, not operational diagnostics. They summarize the total energy consumed and report the single highest demand recorded during the billing period. However, the bill does not reveal when that peak occurred or what equipment was operating at the time. Interval meter data, which records power usage every 15 or 30 minutes, is required to see the building’s load profile and identify the timing and shape of the peak demand event. By examining interval data, analysts can determine whether the spike occurred during morning startup, during peak cooling hours, or during an unusual operational event, allowing more targeted strategies to reduce demand charges.