What Is Peak Demand in Electricity? Formula, Example, and Demand Charges Explained
What Is Peak Demand in Electricity
Peak demand in electricity is the highest level of power a building draws from the electrical grid during a short measurement interval within a billing cycle. Utilities measure this demand in kilowatts (kW), which represents the rate at which electricity is being used at a given moment.
Unlike total electricity consumption, which is measured in kilowatt hours (kWh), peak demand reflects how quickly electricity is used during a specific period of time. Even a building with relatively low overall energy use can create a high peak demand if large equipment operates simultaneously.
Because electrical infrastructure must be built to handle these short periods of high load, peak demand in electricity plays a central role in how commercial electricity bills are calculated.
How Utilities Measure Peak Demand
Utilities measure peak demand using smart meters that record electricity usage in short time intervals. Most commercial meters store this data every 15 or 30 minutes.
For each interval, the meter calculates the average demand in kilowatts based on the energy used during that period. Over the course of a month, hundreds of these intervals are recorded.
At the end of the billing cycle, the utility identifies the highest interval demand recorded. This value becomes the building’s peak demand for the billing period.
How Demand Charges are Calculated
Demand charges are calculated using the building’s peak demand and the demand rate defined in the utility tariff.
Meters determine demand using what is often referred to as the peak demand formula:
Peak Demand (kW) = Energy Used During Interval (kWh) ÷ Interval Length (hours)
During each measurement interval, the meter converts energy usage into an average demand value in kilowatts. The highest demand interval recorded during the billing cycle becomes the building’s peak demand.
The demand charge on the electric bill is then calculated using:
Demand Charge = Peak Demand (kW) × Demand Rate ($ per kW)
Because this calculation is based on the highest interval rather than total monthly consumption, even a short spike in electricity use can significantly increase a building’s demand charges.
“The grid no longer prices electricity by how much you use, but by when you use it.”
Peak Demand Example From a Commercial Building
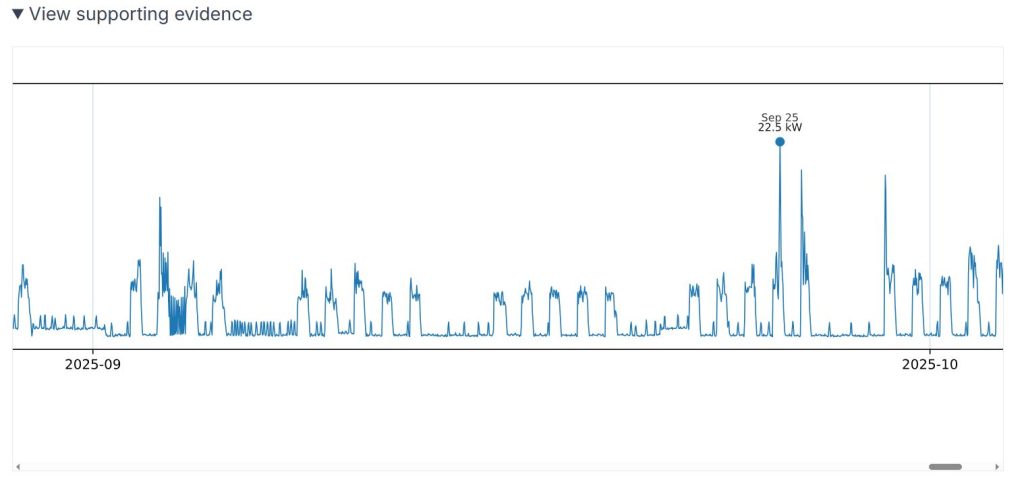
The interval demand trace below shows electricity demand recorded from a commercial building during September 2025. The meter records electricity usage in 30 minute intervals and calculates the average demand in kilowatts for each interval.
During this billing period, the highest interval occurred on September 25 during the 30th interval of the day, corresponding to 2:30–3:00 PM. The average demand recorded during that interval was 22.5 kW. Because utilities bill demand charges based on the highest interval demand recorded during the billing cycle, this value became the building’s peak demand for the month.
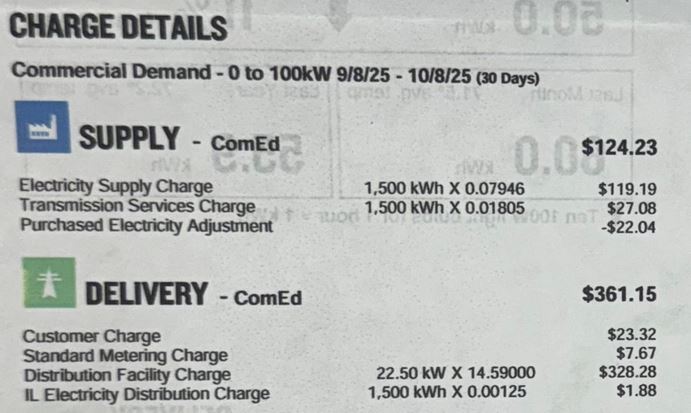
The utility applied a demand rate of $14.59 per kW to this peak demand.
22.50 kW × $14.59 per kW = $328.28
Although the building consumed 1,500 kWh during the month, equivalent to an average demand of roughly 2 kW, the single 30 minute interval reached 22.5 kW. Because demand charges are based on the highest interval rather than average usage, this short spike determined the demand charge on the bill.
Inspection of the interval trace suggests the spike likely occurred when an air compressor operated continuously or overlapped with other equipment during that interval.
Electricity Bills: Supply vs Delivery Charges
Commercial electricity bills are typically divided into two primary components: supply charges and delivery charges.
Supply charges represent the cost of the electricity itself and are based on the total energy consumed during the billing period. These charges are measured in kilowatt-hours (kWh).
Delivery charges cover the cost of transporting electricity across the grid and maintaining the infrastructure required to serve customers. These charges often include demand-based components.
In the example above, the building consumed 1,500 kWh during the billing period, resulting in about $124 of supply charges. However, the delivery portion of the bill included a demand charge based on the building’s peak demand of 22.5 kW, which produced a distribution facility charge of $328.28.
This illustrates how short demand spikes can drive a large portion of a commercial electricity bill.