The platform is composed of three coordinated system layers that ingest interval meter data, execute deterministic diagnostics, and render structured analytical artifacts.
Phantom Link
Ingests interval meter datasets and performs structural validation before analysis.
Phantom Engine
Executes deterministic analytical routines that identify demand morphology and billing drivers.
Phantom Console
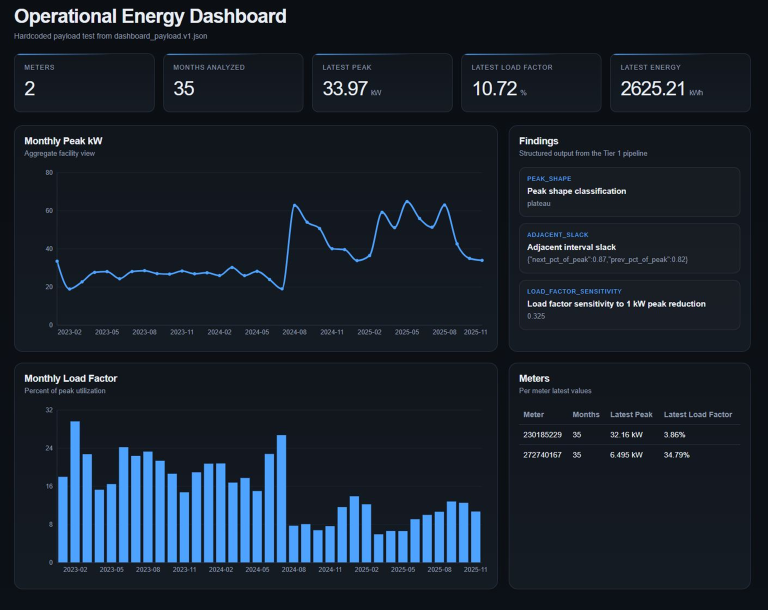
Presents structured diagnostic artifacts through an interactive analytic interface.
SYSTEM EXECUTION PIPELINE
The Phantom Grid platform executes a deterministic pipeline that converts interval meter data into structured diagnostic artifacts.
01
Intake and Validation
Gatekeeping before compute
Uploads are parsed and validated before analysis begins.
02
TIER 1 ENGINE
Deterministic execution
Validated jobs execute and emit a structured diagnostic payload.
03
Diagnostic Synthesis
Sequenced synthesis
Results are sequenced and constrained into a finalized artifact.
04
Evidence Rendering
Rendering only
Visual evidence is generated without altering conclusions.
05
Classification Layer
Stable classification
Computed features are evaluated against fixed thresholds.
Interval data to diagnostic artifact
Interval meter data is ingested, structured, and analyzed to identify demand behavior and billing drivers. Deterministic compute produces a reproducible diagnostic artifact that can be reviewed, shared, and referenced.